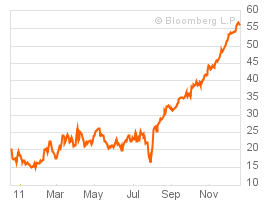
I’ve been watching the TED Spread move up and up over the last couple of months which has been ringing the alarm bells in my head and stopping me from returning to the share market. With news from Europe talking about banks being exposed to European government bonds then the credit system looks like it’s starting to freeze up again. The last time that happened it wasn’t pretty!
“The TED Spread is the difference between the interest rates on interbank loans and on short-term U.S. government debt (“T-bills”). TED is an acronym formed from T-Bill and ED, the ticker symbol for the Eurodollar futures contract.” Wikipedia
Typically the TED Spread sits between a range of 20-50 basis points. Over that range is considered a sign that there is perceived credit risk in the system. This means that with the TED Spread now over the 50 basis points mark that the bankers are not trusting each other.
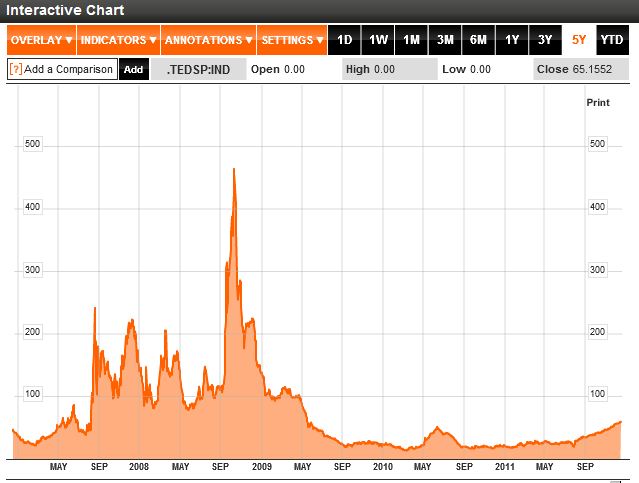
You can see how good an indicator the TED Spread is for times of financial turbulence by looking at the TED Spread 5 year chart. The problems of 2008-2009 are clearly seen.
Credit, where credit is due (no pun intended), you can access this information on Bloomberg’s site.
While the current TED Spread of around 57 basis points is tiny when compared to the peak in 2009 you can see that it is definitely above the “normal” area and heading into dangerous territory.
With all the news coming out of Europe of “solutions” to their debt problems it looks like whatever the Europeans do it’s not having a material impact on the TED Spread. That translates to me as “the bankers are not buying the politicians solutions.” and that’s the reason why the alarm bells are ringing in my head!


